Screenshots & Visual Guide
Explore the Rustic Debug interface through these annotated screenshots and visual guides.
Dashboard Page
The Dashboard page is your entry point to debugging. It displays all available RusticAI guilds in your Redis instance with real-time metrics.
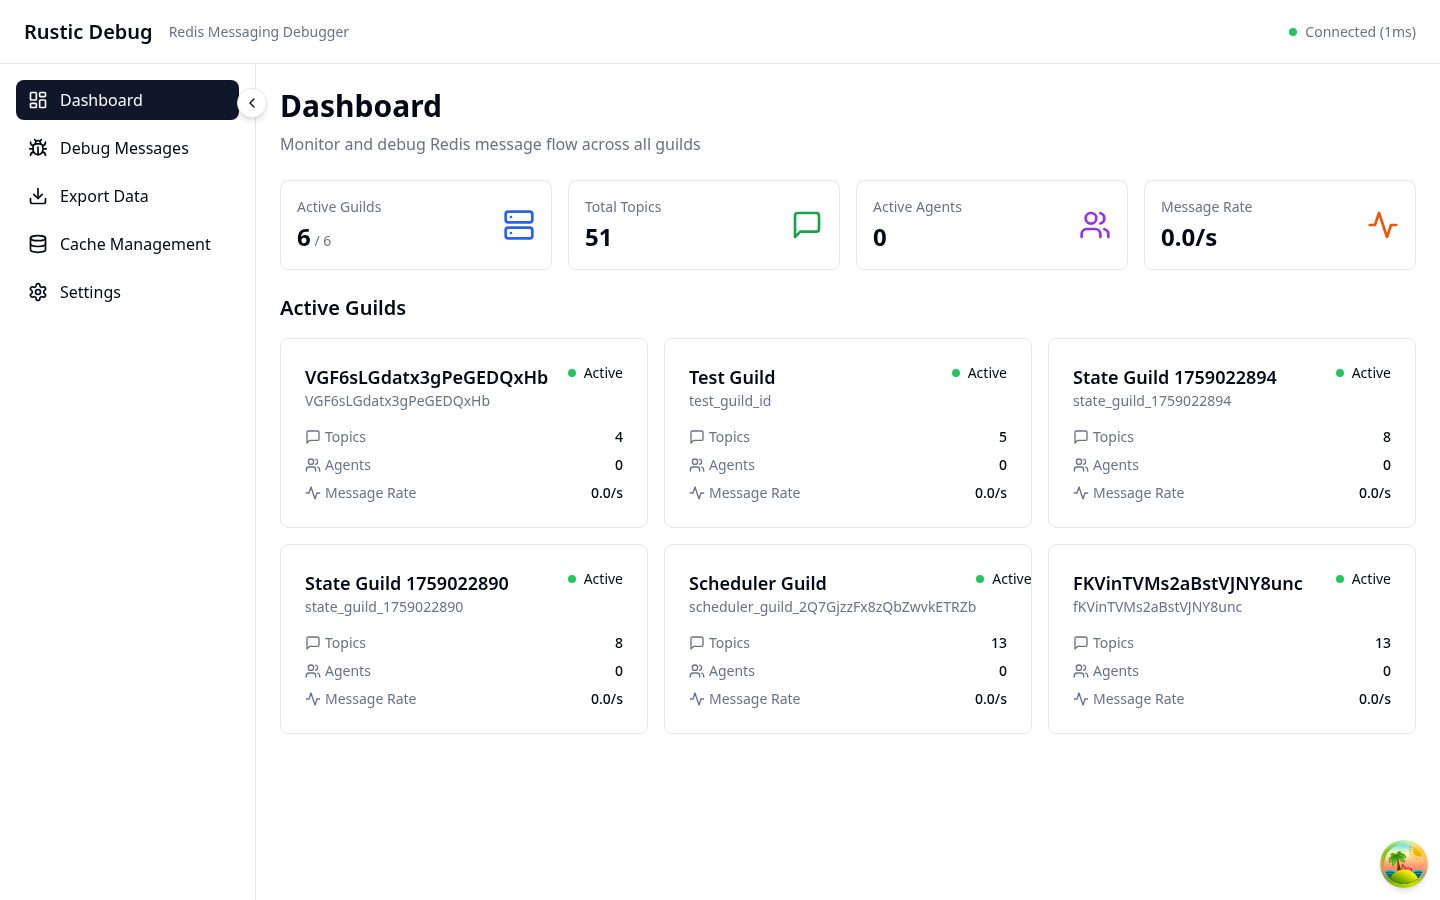
Key Features:
- Guild Cards: Each guild is displayed as a card showing:
- Guild name and ID (e.g., "Test Guild" with ID "test_guild_id")
- Number of active topics (e.g., "5 Topics")
- Active agent count (e.g., "0 Agents" when idle)
- Real-time message rate (e.g., "0.0/s")
- Active status indicator (green dot)
- Summary Statistics Bar: At the top showing:
- Active Guilds: 6/6
- Total Topics: 51
- Active Agents: 0
- Message Rate: 0.0/s
- Connection Status: Top-right indicator showing "Connected (1ms)"
- Quick Navigation: Click any guild card to debug its messages
Debug Dashboard
The main debugging interface provides comprehensive tools for message analysis.
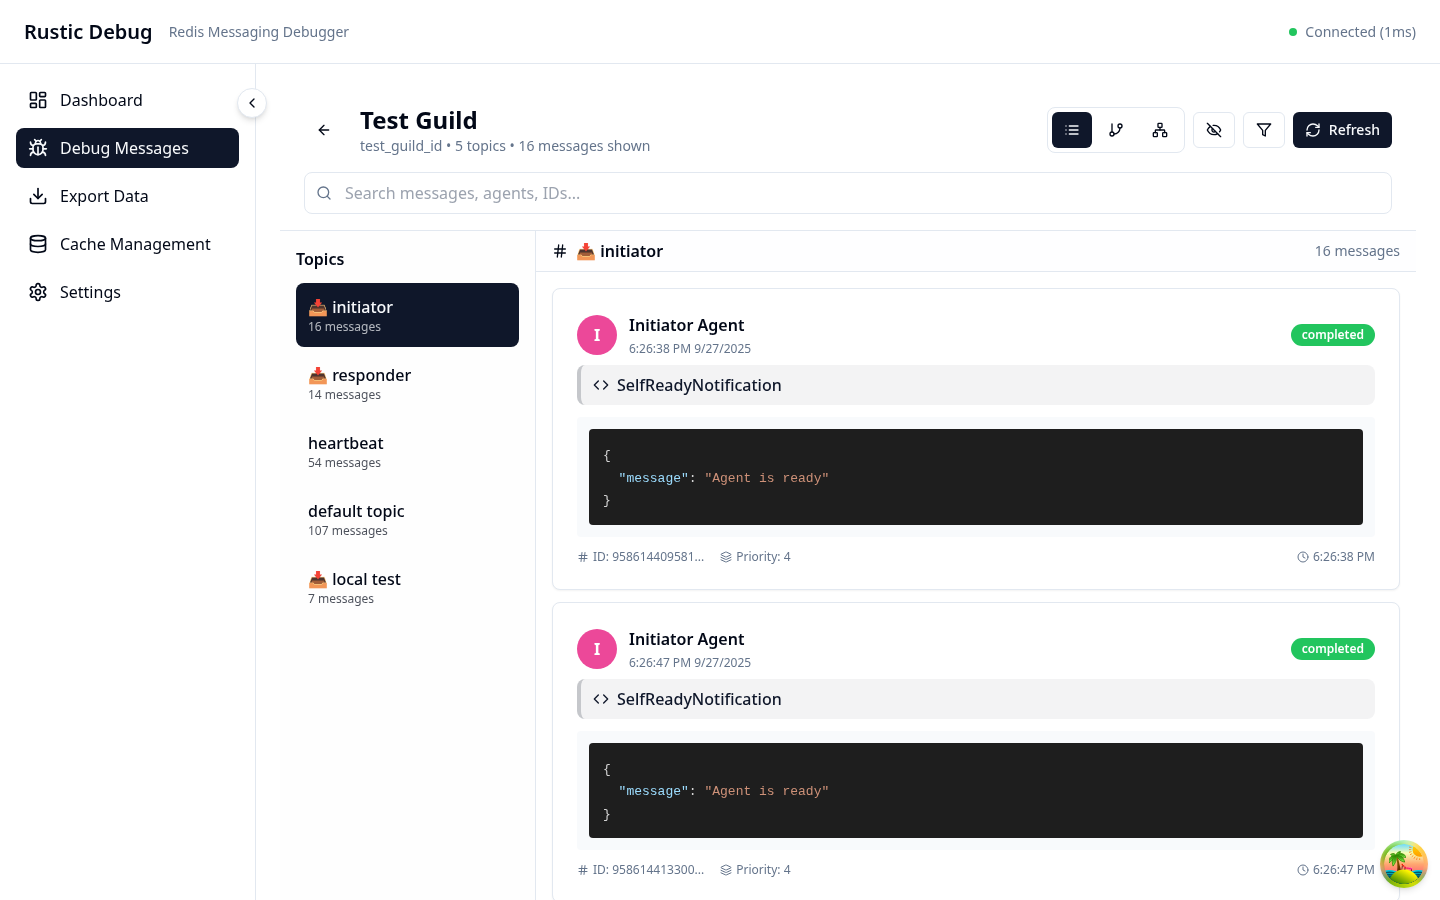
Dashboard Components:
- Header Bar: Guild name, connection status, and view controls
- Sidebar: Navigation between different views
- Main Content Area: Dynamic content based on selected view
- Metrics Bar: Real-time statistics and performance metrics
Message List View
The List View presents messages in a chronological format with topic filtering on the left sidebar.
List View Features:
Topic Sidebar (Left)
- Topic List with message counts:
- 📥 initiator (16 messages)
- 📥 responder (14 messages)
- heartbeat (54 messages)
- default topic (107 messages)
- 📥 local test (7 messages)
- Selected topic is highlighted with dark background
Message Cards (Center)
- Agent Information:
- Circular avatar with initial (e.g., "I" for Initiator Agent)
- Agent name and exact timestamp
- Message Details:
- Status badge (green "completed" badge)
- Message type (e.g., "SelfReadyNotification")
- JSON payload with syntax highlighting
- Message ID and priority at the bottom
- Search Bar: "Search messages, agents, IDs..." for quick filtering
Message Inspector
When you click on a message, the inspector panel opens:

Inspector Details:
- Message Header: ID, timestamp, and status
- Content Viewer:
- JSON tree view for structured data
- Syntax highlighting
- Copy to clipboard
- Export options
- Metadata Section:
- Processing time
- Retry count
- Thread ID
- Parent message link
- Routing Rules: Shows message routing configuration
- Raw View: Toggle between formatted and raw JSON
Thread View
The Thread View groups related messages by conversation thread for easier tracking.
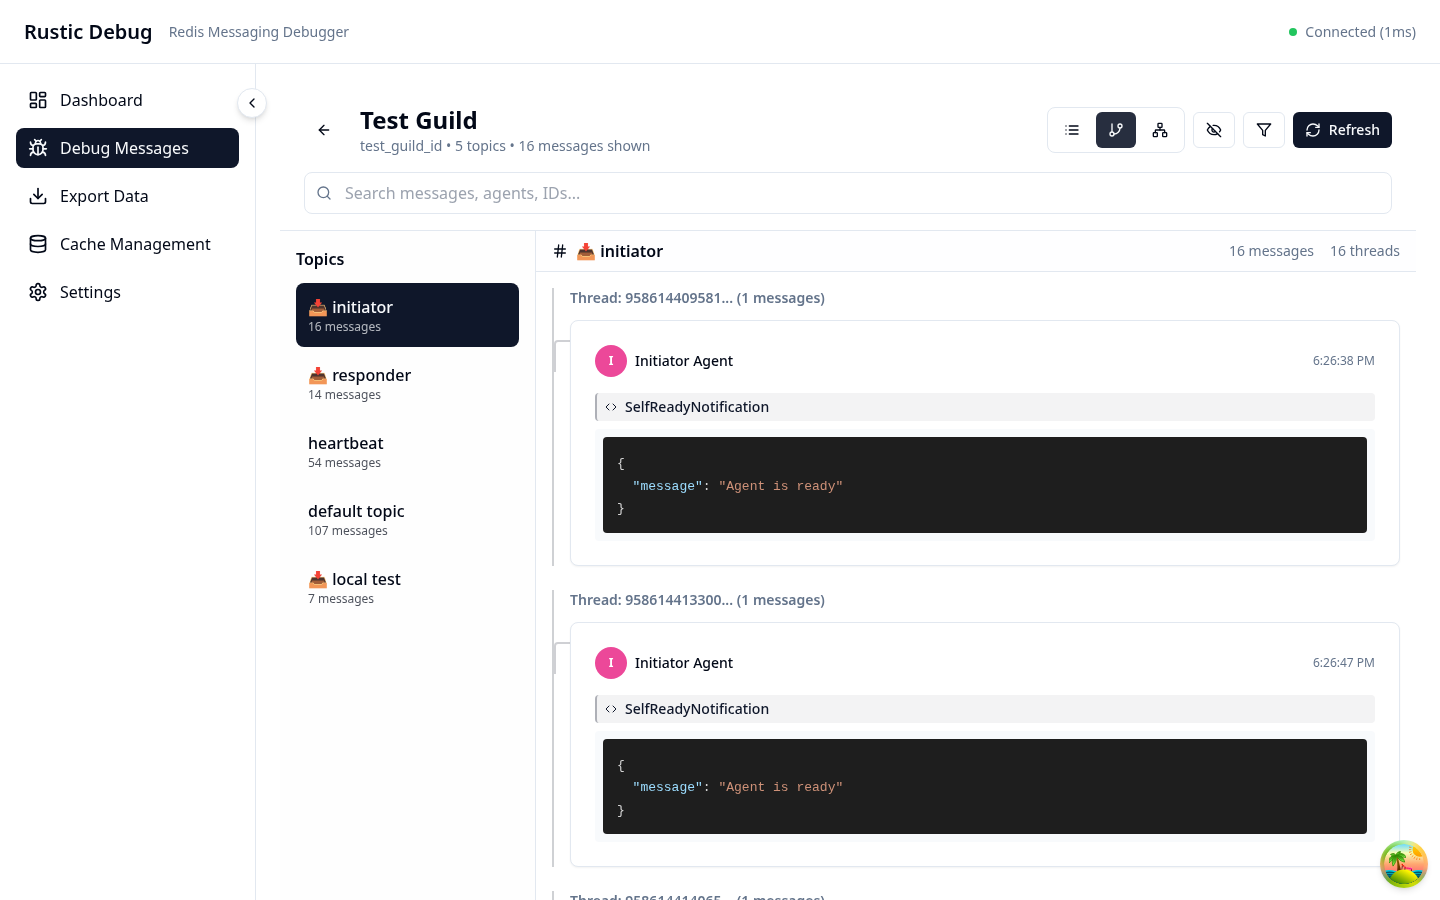
Thread Visualization:
Thread Headers
- Thread Identifier: Shows truncated thread ID (e.g., "Thread: 958614409581... (1 messages)")
- Message Count: Number of messages in each thread
- Thread Count Indicator: "16 messages" and "16 threads" shown at the top
Thread Content
- Compact Message Display: Each thread shows:
- Agent avatar and name
- Timestamp (time only for same-day messages)
- Message type (e.g., "SelfReadyNotification")
- JSON payload preview
- Chronological Ordering: Threads are arranged by timestamp
- Visual Separation: Each thread is clearly separated for easy scanning
Benefits of Thread View
- Context Preservation: Related messages stay together
- Conversation Tracking: Easy to follow request-response patterns
- Debugging Workflows: Identify where conversations break or fail
- Performance Analysis: See thread durations at a glance
Graph View
The Graph View provides an interactive visualization of message flows using a node-based graph.
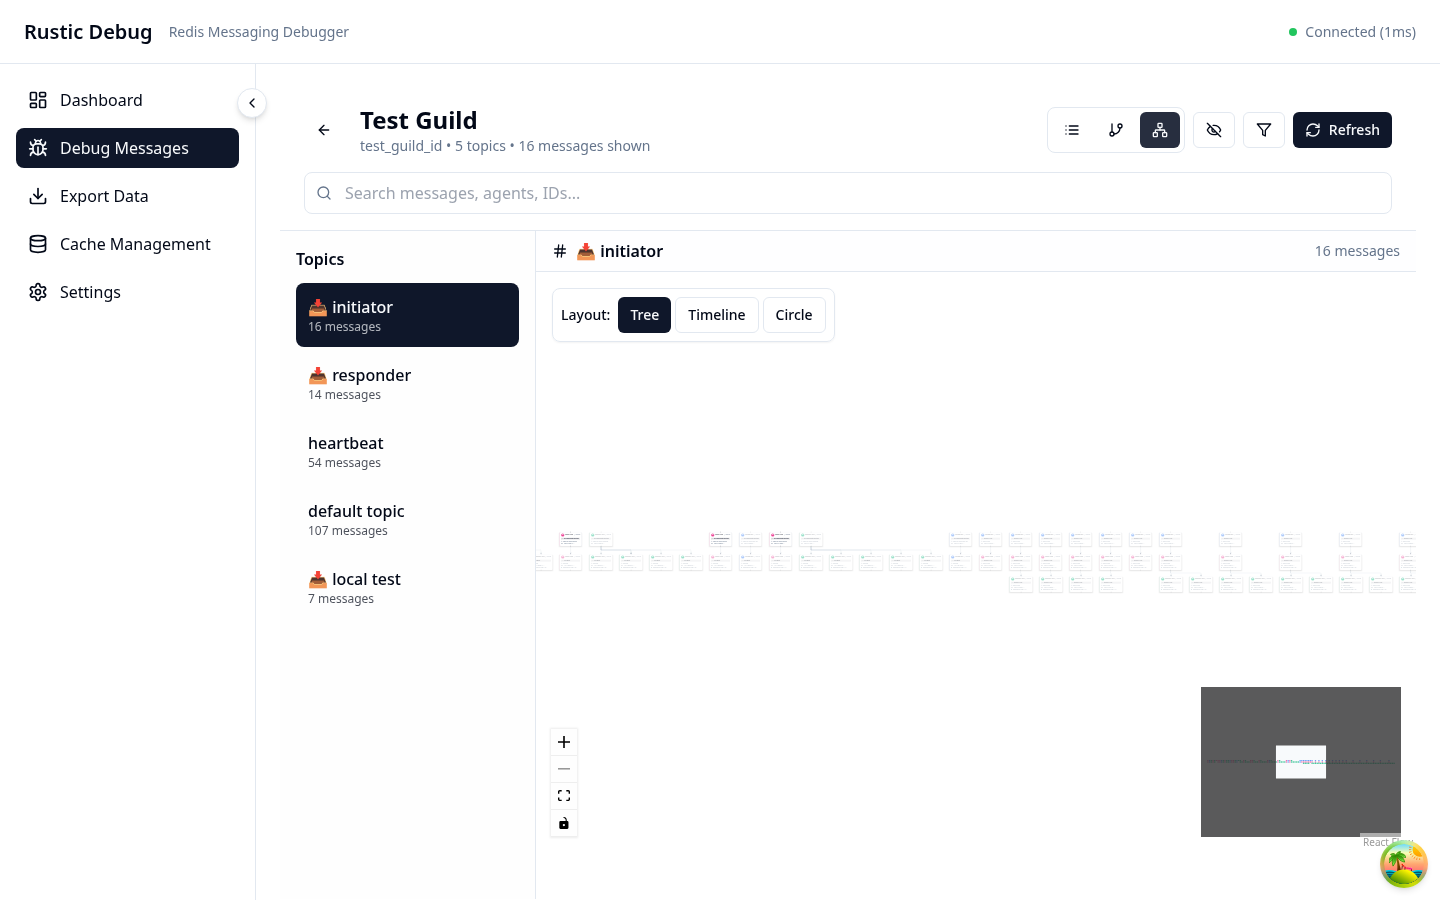
Graph Visualization Components:
Layout Controls (Top Bar)
- Layout Options: Toggle between different visualization modes
- Tree layout (hierarchical structure)
- Timeline layout (temporal arrangement)
- Circle layout (radial distribution)
- View Mode Icons: Quick access to different visualization styles
Interactive Canvas
- Node Visualization: Messages and agents represented as connected nodes
- Visual Flow Lines: Shows message routing and relationships
- Canvas Controls (Bottom-right):
- Plus/Minus buttons for zoom in/out
- Fit-to-screen button
- Fullscreen toggle
- Pan controls for navigation
Graph Features
- Real-time Updates: Graph updates as new messages arrive
- Interactive Exploration: Click and drag to explore the graph
- Focus on Context: Selected topic ("initiator") highlighted in sidebar
- Visual Hierarchy: Node size and color indicate importance and type
Use Cases for Graph View
- System Architecture Visualization: Understand how agents communicate
- Bottleneck Detection: Identify high-traffic routes
- Debug Message Routing: Trace message paths visually
- Performance Analysis: See which paths have delays or errors
Real-time Monitoring
The real-time monitoring view shows live message flow.

Real-time Features:
- Live Message Stream: Messages appear as they arrive
- Activity Graph: Rolling time-series chart
- Alert Panel: Real-time alerts and warnings
- Performance Gauges: CPU, memory, and throughput meters
Filter & Search Interface
Advanced filtering capabilities for finding specific messages.

Filter Options:
- Quick Filters: Pre-configured common filters
- Advanced Query Builder: Build complex queries
- Saved Filters: Save and reuse filter configurations
- Filter History: Recent filter queries
Export & Reporting
Export functionality for sharing and analysis.

Export Options:
- Formats: JSON, CSV, PDF, HTML
- Scope: Current view, filtered results, or time range
- Include Options:
- Messages
- Metadata
- Thread context
- Performance metrics
Settings & Configuration
Configure Rustic Debug for your environment.

Settings Sections:
- Connection Settings: Redis connection configuration
- UI Preferences: Theme, layout, refresh rates
- Performance: Caching, sampling, limits
- Security: Authentication, encryption
- Advanced: Debug options, experimental features
Mobile Responsive Views
Rustic Debug is fully responsive for mobile debugging.
Mobile List View

- Optimized table layout
- Swipe actions
- Collapsible panels
Mobile Graph View

- Touch-optimized controls
- Simplified visualization
- Gesture support
Dark Mode
All views support dark mode for comfortable debugging at any time.

Dark Mode Features:
- High contrast text
- Reduced eye strain
- Syntax highlighting optimized for dark backgrounds
- Automatic theme switching based on system preferences
Keyboard Shortcuts
Quick reference for power users:
| Shortcut | Action |
|---|---|
Ctrl/Cmd + K |
Quick search |
Ctrl/Cmd + F |
Filter messages |
Ctrl/Cmd + G |
Toggle graph view |
Ctrl/Cmd + L |
Toggle list view |
Ctrl/Cmd + T |
Toggle thread view |
Ctrl/Cmd + R |
Refresh data |
Ctrl/Cmd + E |
Export current view |
Esc |
Close panels/modals |
Space |
Pause/resume live updates |
Video Tutorials
For a more comprehensive understanding, check out our video tutorials:
- Getting Started (5 mins) - Basic navigation and setup
- Debugging Workflows (10 mins) - Common debugging scenarios
- Advanced Features (15 mins) - Power user features
- Performance Analysis (8 mins) - Using metrics and profiling
Next Steps
Now that you're familiar with the interface:
- Learn Basic Usage - Start debugging
- Explore Advanced Features - Power user features
- Read API Docs - Integrate with your tools